
|
|
I-LENSE Mote Network Visualization |
|---|
Current release: 0.3 (10/30/06)
This is a suite of software (3 host side modules, plus mote code) for Linux which allows the user to capture packets from a live sensor network. During and after the capture, the user is able to view the contents of the packets in human-readable format, as well as to view the flow of packets as a whole in an intuitive and customizable manner. Additionally, certain kinds of aggregate data can be generated automatically including detailed and useful network activity visualizations for S-MAC networks (see below).
MNV currently supports analysis of traffic using Berkeley MAC (B-MAC), Sensor MAC (S-MAC), and Synchronized Channel Polling MAC (SCP-MAC).
Please note that this is beta-quality software. While it is considered to be useable and useful, it is not feature-complete and has a few outstanding bugs (noted in README)
Version 0.3 adds the following improvements to MNV:
Extensive documentation, such as installation and usage instructions, FAQ, and information for extending the software can all be found in the README file:
Also useful may be this poster on the MNV suite presented at CENS in August 2005. (Note that the poster uses an older name of the suite and excludes more recent additions).
MNV consists of a version of the network analysis tool Ethereal, augmented to support sensor network protocols and a set of tools that do the job of getting the packets from the motes to Ethereal.
In contrast to previous releases, there is only one file to download to get MNV 0.3. It is larger, but much simpler to handle. That file is:
This archive includes RPMs for x86 systems, SRPMs for other RPM-using systems, a patch against ethereal sources for non-RPM systems, and complete MNV source code for developers. The README file explains how to install using either RPMs or patches.
If you choose to install using patches, you must also download a copy of the unmodified ethereal sources. They can be downloaded here:
Note that MNV 0.3 is built against Ethereal version 0.10.11 which is not the most recent version. If you have trouble getting MNV to patch against a later version of Ethereal which you absolutely need to use, contact us (see below). The patch will almost certainly fail on earlier versions, so please use at least 0.10.11.
Here are two screenshots of the software in action, analyzing a flow of packets on a sensor network (click for full size):
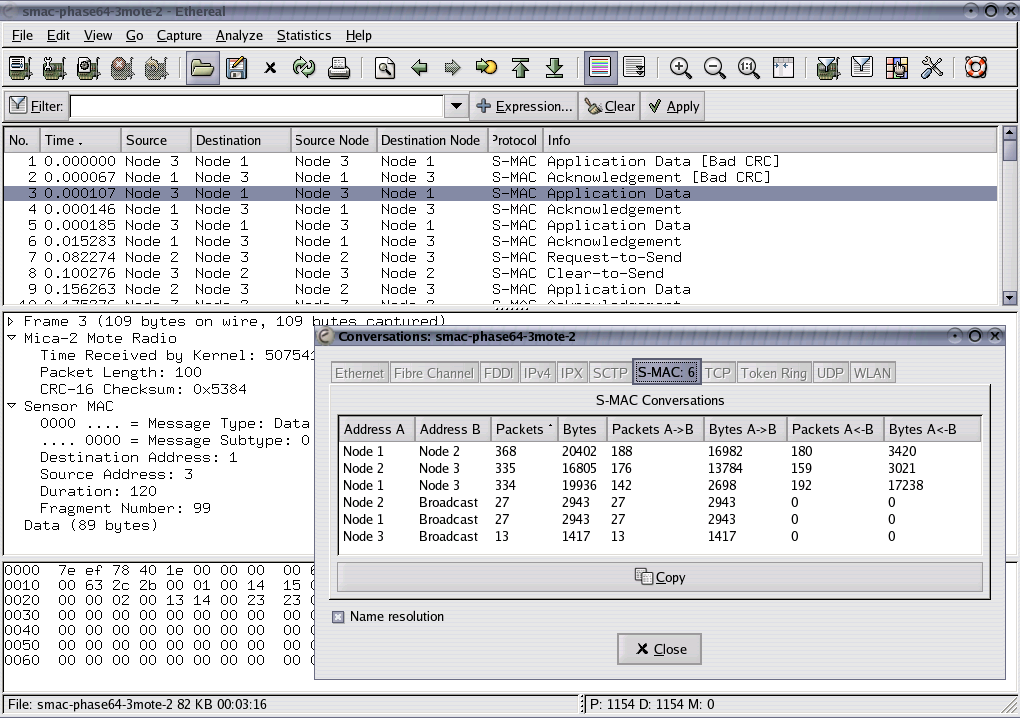
View of the entire interface,
including the "connections" analysis dialog.
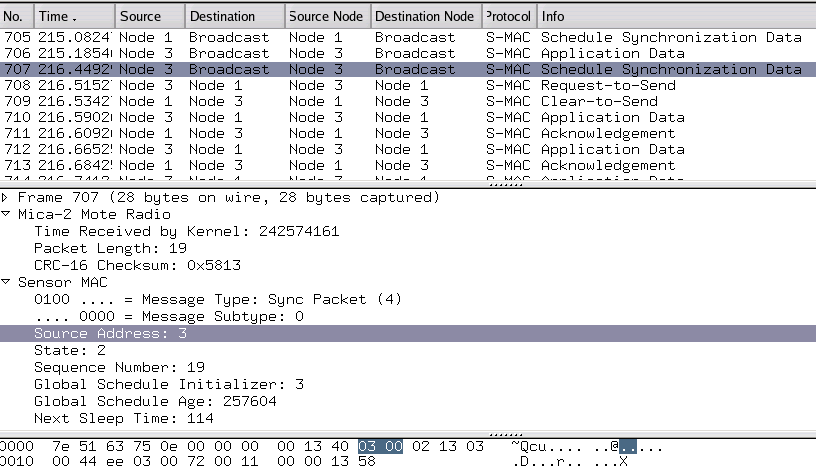
Close-up of the analysis of an
S-MAC flow.
This will allow a graphical representation of which nodes are asleep, transmitting, or recieving at any given time. The intent is to give a high-level overview of the "activity patterns" of a given network.
Here is a screenshot showing some (real) example data:
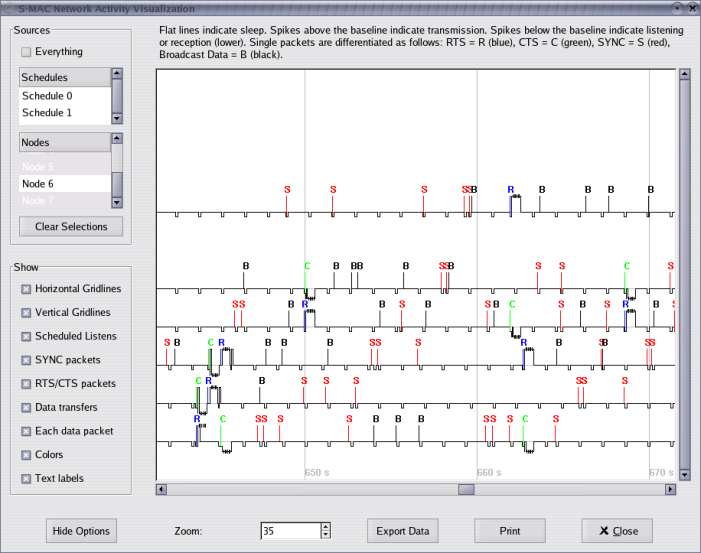
Notice that you can select which node(s) to view based either on which schedule they are on or by node number. You can also choose to hide or show certain types of packets and visual features. ACK packets remain supressed due to space concerns, but tic marks on send and receive lines indicate individual packet transmission and reception respectively.
MNV's S-MAC visualization output will be printable and exportable to both jdb and gnuplot-ready dump files so that you can perform any custom post-processing that may be necessary for your application.
The screenshot above was taken from a late development version of 0.2. The buttons at the bottom are slightly different in the final version. "Print" is "Save as Image", and the zoom control is arranged differently.
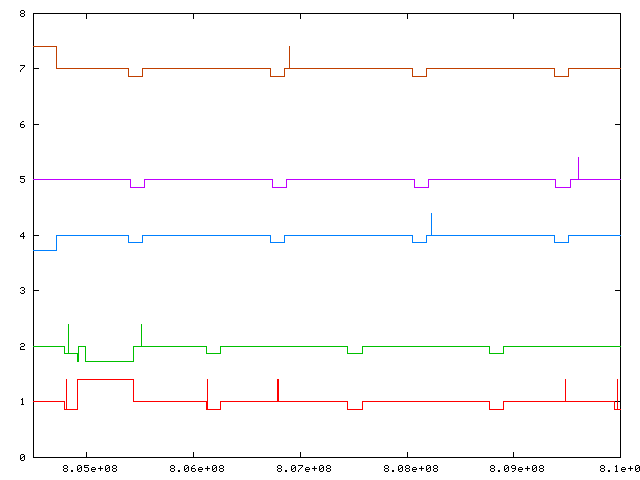
Here are a few images of the prototyping of S-MAC visualization output before it was implemented within Ethereal. The released version of S-MAC visualization will allow exporting of data into format suitable for input into gnuplot, which will enable you to render images such as these yourself if you feel the need to tweak the output in some way that the built-in tool does not allow.
These are real data from MNV, but rendered in gnuplot. Level lines indicate sleep. Small drops indicate listening. Large drops indicate receiving. Large rises indicate sending. Single spikes upward indicate broadcast packets or RTS/CTS (will be differentitiated in final version). ACKs are hidden in these examples.
This shows about 5
seconds of 5 nodes on 2 schedules. 1 and 2 are on one schedule and
4,5,7 are on another schedule as you can clearly see from the
listen times. Probably the most interesting part about this graph
besides the different schedules is that you can see nodes 1 and 2 sending SYNC
packets to the opposite schedule.

This shows about a
minute of 7 nodes all on the same schedule. The final implementation
will include the option to hide regularly scheduled listen periods in
order to make data transfers stand out from the clutter.
Work is now on making moteradio a more stable diver and on adding new protocols. If you have a mote network protocol that you would like to be supported in Mote Network Visualization, contact us.
This material is partially based upon work supported by the National Science Foundation (NSF) under Cooperative Agreement #CCR-0121778 (CENS), and partly supported by CiSoft (Center for Interactive Smart Oilfield Technologies), a Center of Research Excellence and Academic Training and a joint venture between the University of Southern California and Chevron Corporation.