Analyzing Carbon Dioxide levels while attending IETF-115 in London, UK
Table of Contents
- 1. Introduction
- 2. Conclusions
- 3. 2022-11-05 Fri: Getting there – SMF -> LHR
- 4. 2022-11-06 Sun: Day 0 – the early work day before the real start
- 5. 2022-11-07 Mon: Day 1 – the meeting really begins
- 6. 2022-11-08 Tue: Day 2 – buses are a big problem
- 7. 2022-11-09 Wed: Day 3 – a generally cleaner air day
- 8. 2022-11-10 Thu: Day 4 – chairing two meetings
- 9. 2022-11-11 Fri: Day 5 – wrapping up the conference
- 10. 2022-11-12 Sat: The journey home
1. Introduction
I went 2.5 years with no plane fights and minimal in-person contact to suddenly "everyone must get back to normal! get on those planes! let's have lots of face to face meetings!". I, like many others, wanted to continue minimizing my risk of getting sick from airborne viruses while acknowledging being successful in my career required a lot of social networking. So, I've been vaccinated, I wear N-95 masks, and I make judgments along the way about what activities are acceptable to participate in. But… until this trip to IETF-115 in London, UK, I haven't had numbers to back up my decisions.
1.1. Virus Risk Measurement Approach
Just before this 6th-ish trip for the year I decided to purchase an aranet4 \(CO_2\) sensor. There is some belief that by measuring \(CO_2\) you can indirectly measure your risk to airborne viruses, since more \(CO_2\) means you may be around more exhaled air. The aranet4 is a factory calibrated, Non-Dispersive InfraRed sensor (NDIR), and is considered to be one of the more accurate sensors for consumer use.
I used the aranet4 Android App to configure and gather the results from the sensor (using its csv export feature). [side note: timezone manipulation is a pain – the date stamps in the exported CSV is in the local timezone of wherever you did the export, which is less than ideal. UTC is a defacto data standard; they should be using it.]
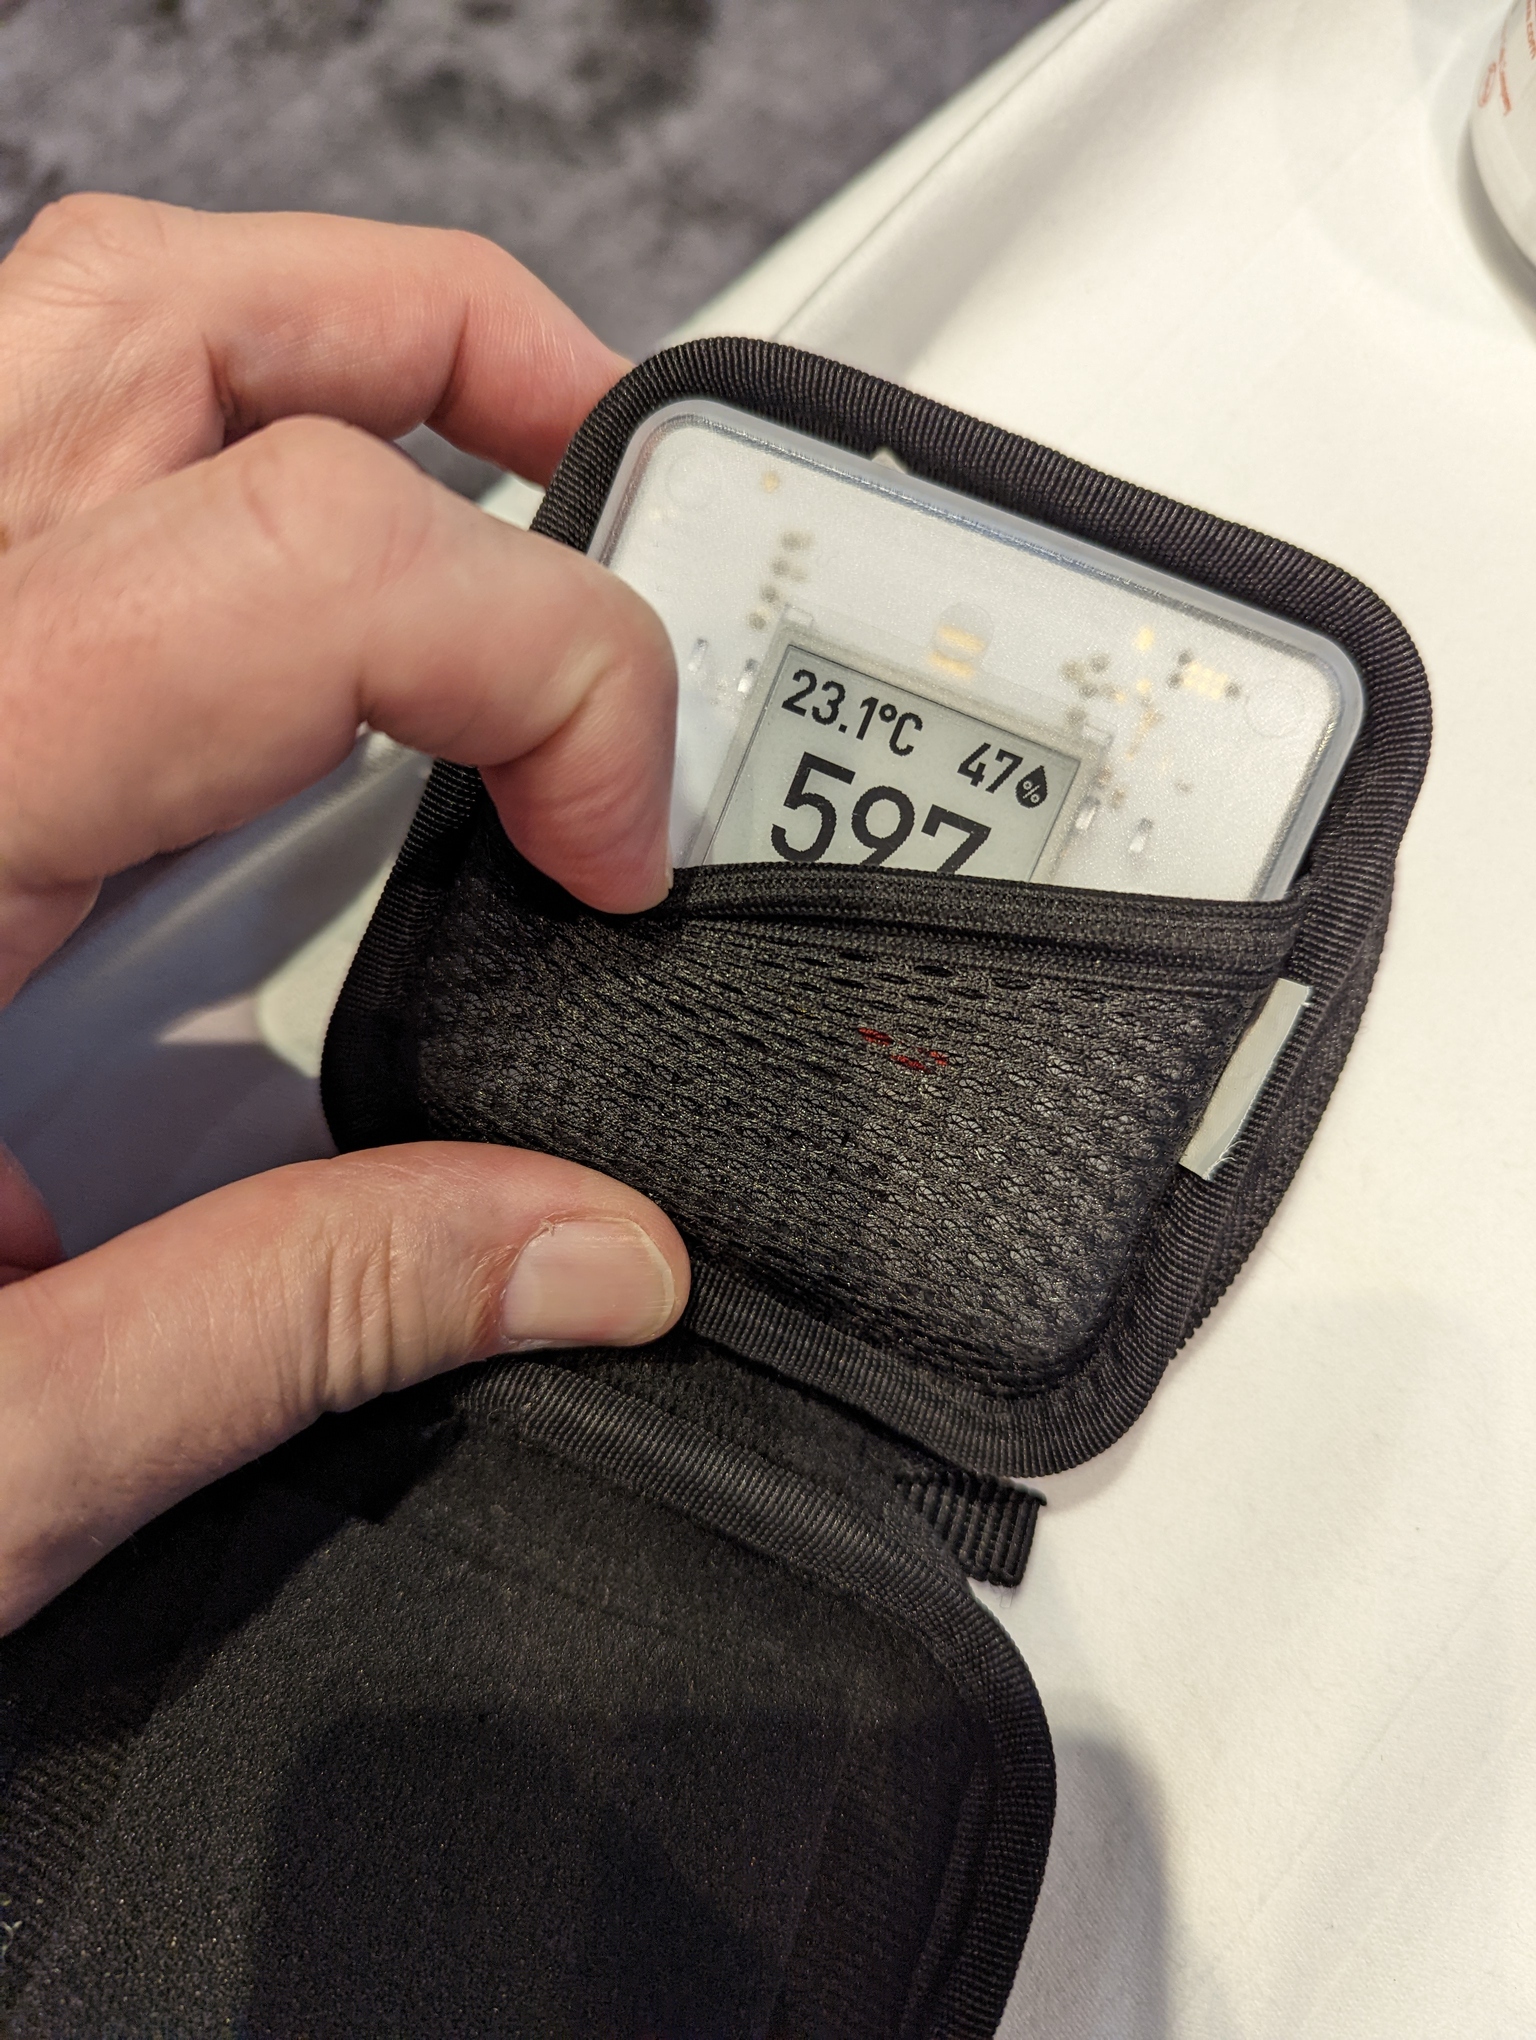
The meter is kept in a cheap padded case from casematix that was technically designed for square chip readers (it doesn't come with one and is known to be fragile). I either put it next to me where I'm sitting, or have it otherwise near the open air sticking out of a backpack pocket or clothing pocket. The picture below shows the meter sitting in the Richmond 2 meeting room.
Generally, I had the sensor recording \(CO_2\) levels every minute or two. To analyze, produce and draw conclusions from the graphs below, I ended up writing a python program that let me graph and annotate the results.
For some level setting about what are reasonable numbers, I note that my house itself (where just my wife and I live) has \(CO_2\) levels of around 750 Parts Per Million (PPM) most of the time, while walking around outside showed levels of 450-ish. When sitting in my home-office, the \(CO_2\) levels often slowly climb over a few hours to reach 950 PPM (it turns out my office really needs a fan as the single plant on the opposite side of the room is failing to keep up even with my sedentary exhaling). Some research has shown that keeping readings [[https://s1.lexort.com/topics/covid-ventilation/][below 800 PPM] should be the goal to avoid viral contamination.
Note that \(CO_2\) sensors do suffer from changes in altitude, but the math shows that you can adjust readings based on the altitude such that sensor readings are lower than they should be at higher altitudes. Note that the graphs below aren't calculated for altitude adjustment. Since planes are generally pressurized to an equivalent of 6000-8000 feet, and senor drift is typically \(3%\) per 1000 feet of elevation, it means that while in the air the \(CO_2\) levels are likely \(18%\) to \(24%\) higher than shown on the graph.
1.2. Other discussions about this data
- hackernews discussed this post (note: before it was even complete!)
2. Conclusions
Since this post is long, I'll drop my conclusions up front:
- Numbers alone do not effectively measure risk absolutely, you must combine numbers with logic and common sense.
- Airlines with good filtering systems are likely ok. But do aim the fans at you with maximum air flow.
- Don't ride the buses. (and transportation shuttles may not be that much better). [It's now been over 6 days since that bus ride, and I'm still testing negative so I may have gotten lucky from that particular high-exposure risk.]
- Big, open and generally uncrowded areas with high ceilings like airports and train stations are generally pretty good
- Big, open and well circulated conference rooms are also generally ok.
- Hallways and crowded coffee tables are where we need to worry the most. Unfortunately, the masking policy at IETF-115 was sort of backward: in the rooms the circulation was quite good, but in all my graphs you can see a spike as I wandered from one room to another, and this is where masking policies were more lax allowing participants to remove their masks.
- Turn the fan on in your hotel room to reduce \(CO_2\) levels. That being said, a few people have mentioned that when you don't know where the air is coming from this could potentially be worse for virus contamination.
3. 2022-11-05 Fri: Getting there – SMF -> LHR
One of the largest fears of trying to avoid virus exposure while traveling involves airports, airplanes, subways, and taxis (oh my). My trip to London, Uk is divided below into two parts: the short-haul flight from Sacramento, CA, US to Denver, CO, US followed by the longer-haul flight from Denver, CO, US to London, UK.
3.1. SMF to DEN
The graph with marked interesting points along the way is below:
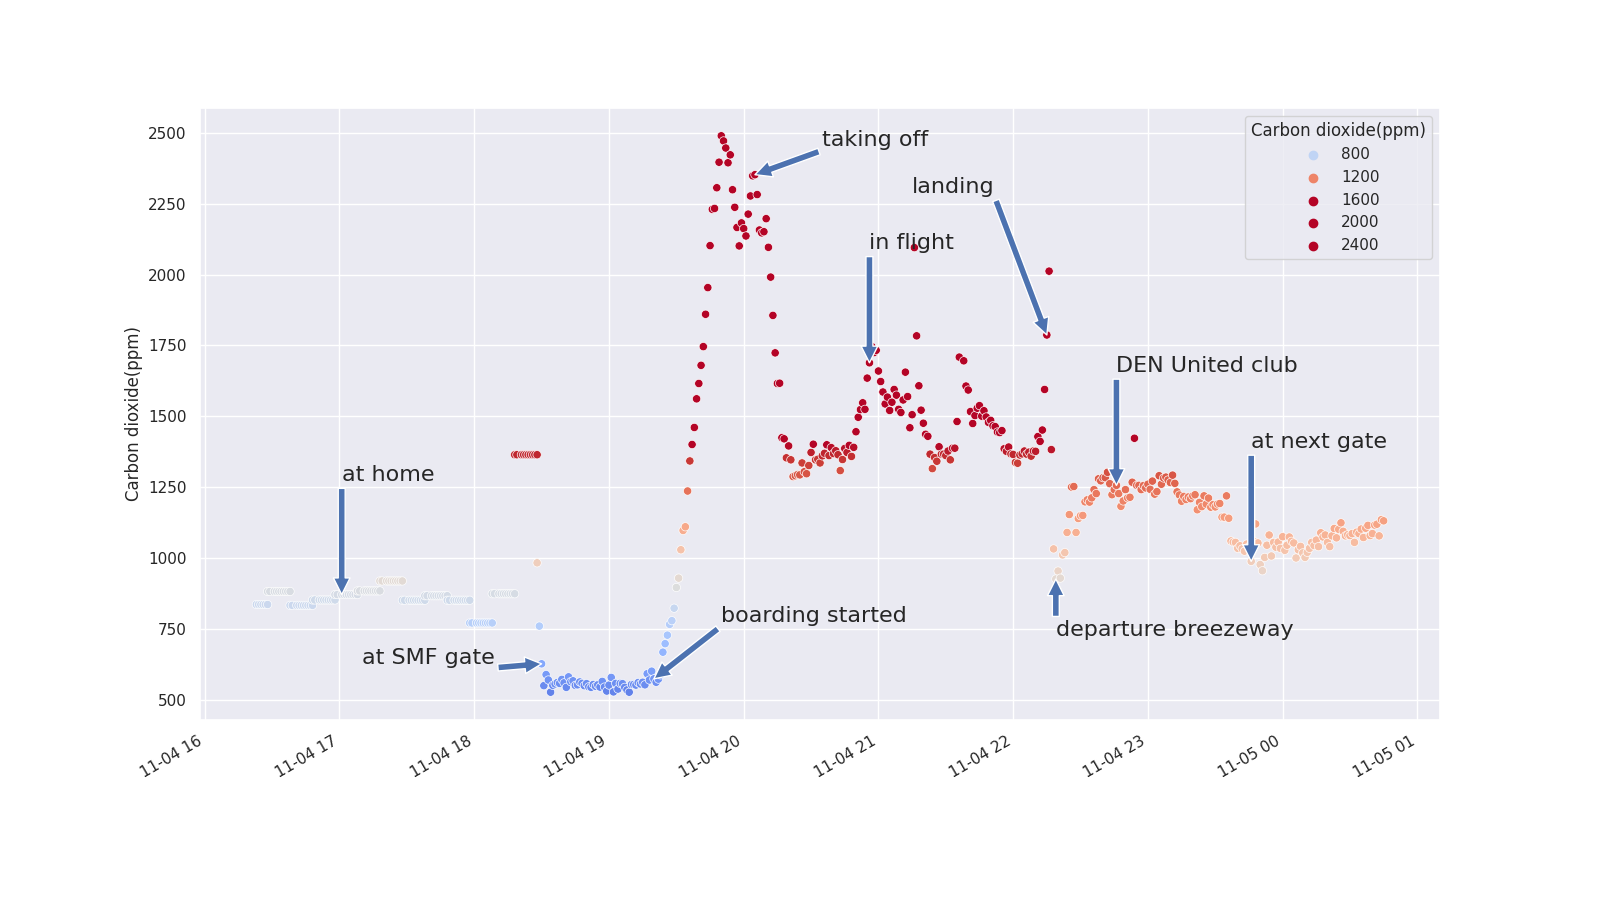
A number of things surprised me in these results:
- Airport gates/hallways are significantly better ventilated than I had thought they would be. Even in a crowded airport, I could find clean air space somewhere reasonably away from others.
- Tightly packed airline club lounges, on the other hand, were a nightmare of too many people and, thus, high levels of \(CO_2\). Though I found spots along the edge that were away from most people, it was impossible to find anywhere with a reasonably low level of \(CO_2\). The boarding gate I went to afterward was significantly better (though still not as good as the more empty Sacramento gate I started my trip at).
- I always get sleepy right when taking off on a plane, and now I know why: The recorded \(CO_2\) level of 2500 as we were taking off was significantly higher than desired. Note that at 1400 PPM it is commonly believed that mental cognition begins to be impaired.
- Though the measured \(CO_2\) levels were significantly higher than I would have liked, I actually rate my risk of viral exposure here much lower than the united lounge. My reasoning: I had the air vent streaming directly across my face, and the air from it supposedly comes through a HEPA filter which means it was likely fairly virus free even if the \(CO_2\) was that high. Someone pointed me at a paper about Boeing's filtering. Another good reference from IATA about Cabin Air & Low Risk of On Board Transmission In the end, you must use logic combined with measurements to evaluate potential virus exposure risk.
Note: the airplane was a Boeing 737-900.
3.2. DEN to LHR
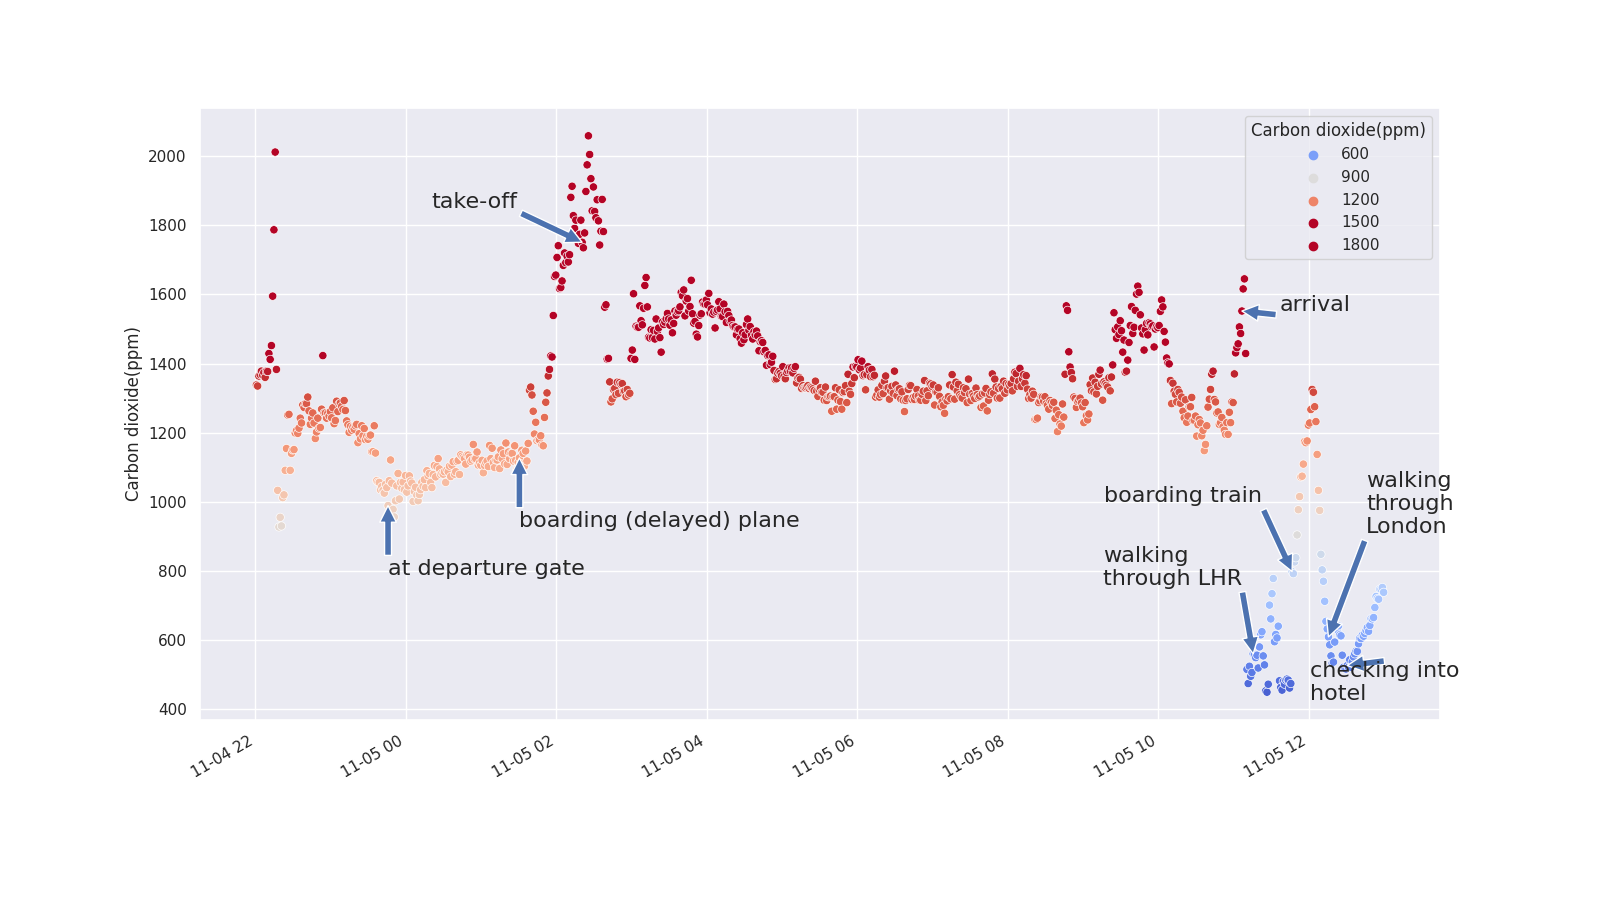
Like the national flight, my international leg was less than ideal:
- The takeoff again had a high \(CO_2\) peak, as did the arrival.
- I had heard that international flights might have better in-flight \(CO_2\) levels. Nope.
- After arriving and getting onto the exit tunnel, the \(CO_2\) dropped to nearly outside levels, and stayed very low even to the point of waiting for the express train to London.
- Once on the train (a 15 minute journey), the \(CO_2\) began slowly climbing until I finally arrived at Paddington Station. I'm glad the ride wasn't longer.
Note: the airplane was a Boeing 787-9.
4. 2022-11-06 Sun: Day 0 – the early work day before the real start
Sunday at the IETF, at least for me, is full of greeting long-time friends, attending side meetings, and the welcome reception, etc. The graph below shows the extent of my day:
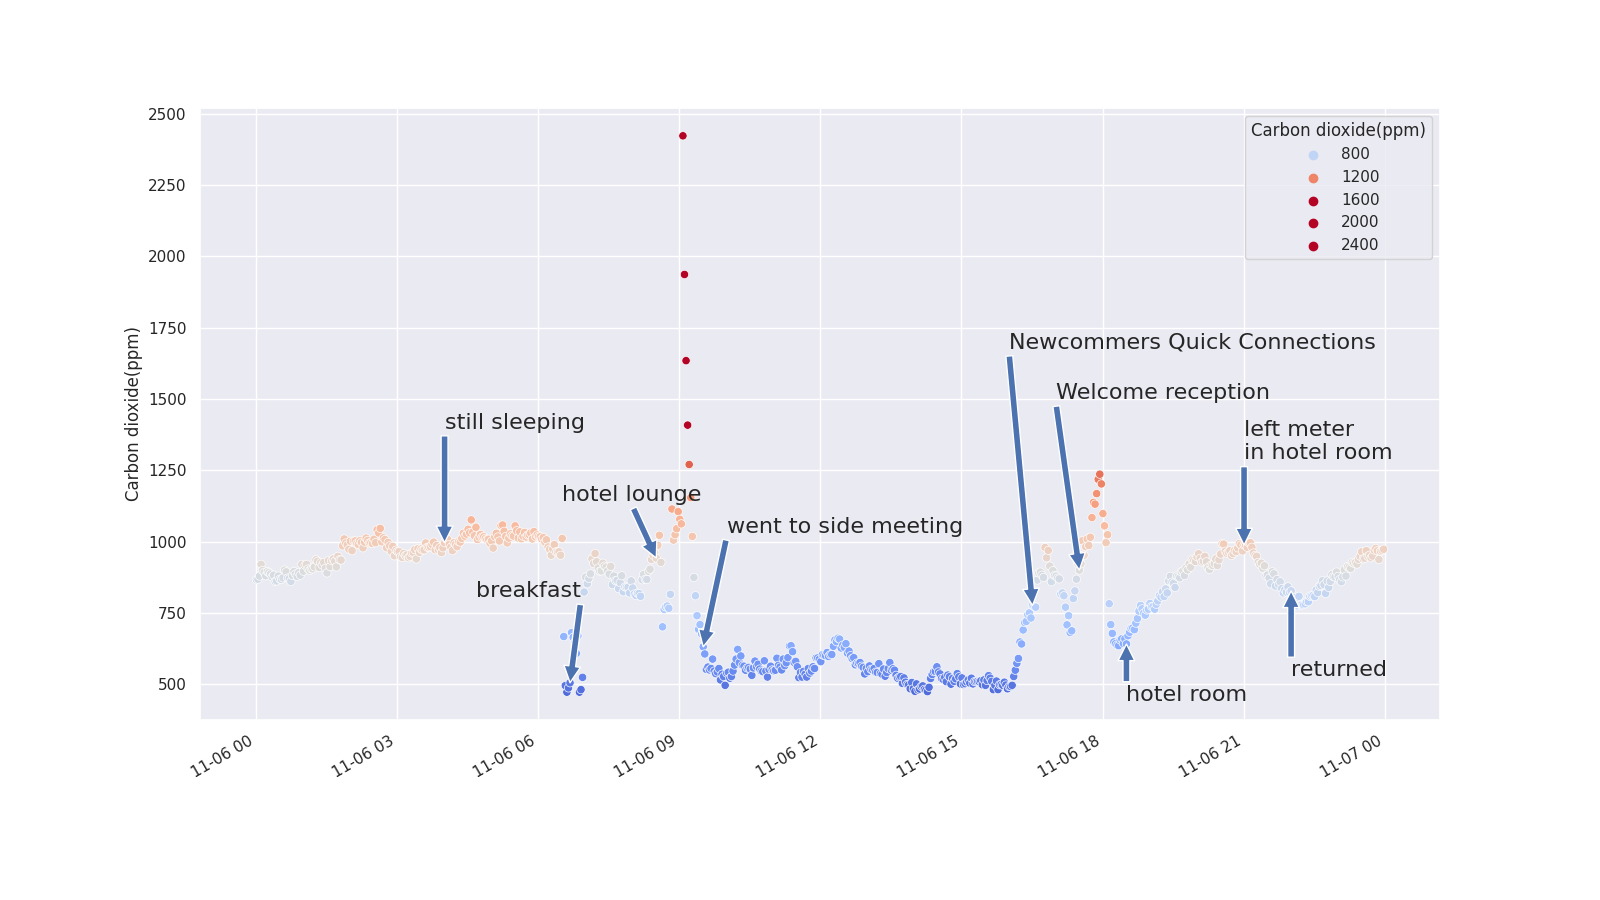
Some thoughts:
- The levels of \(CO_2\) were fairly high while I was sleeping at night. Fortunately, my virus exposure was low (being alone), but I was unhappy with not having fresher air – my windows were locked shut unfortunately. (More on this problem later.)
- Early in the day (when few people were there yet, at least), the breakfast area had reasonably low \(CO_2\) levels.
- I have a feeling that the huge spike seen just after breakfast and before entering the side meeting was from an elevator ride that ended up getting fairly full and stopping at nearly every floor. By my memory of that time is hazy, unfortunately.
- The meeting room I was in all day had near outdoor levels of \(CO_2\), which was pleasantly surprising. (This turned out to be generally consistent throughout the week. Big rooms with lots of air circulation is certainly helpful.)
- The newcommers quick connections gathering, however, was held in a smaller room with shorter ceilings. With a generally high density of people, the \(CO_2\) levels climbed quickly in the measurement graph. I'm glad I wore my mask the entire time, though my voice got sore from shouting over the din in the room.
- The welcome reception, although in a very large room with high ceilings, also exhibited ramping and high levels of \(CO_2\). This was likely my highest risk point in the day, even though I spent much of the time in the nearby less crowded hallways.
5. 2022-11-07 Mon: Day 1 – the meeting really begins
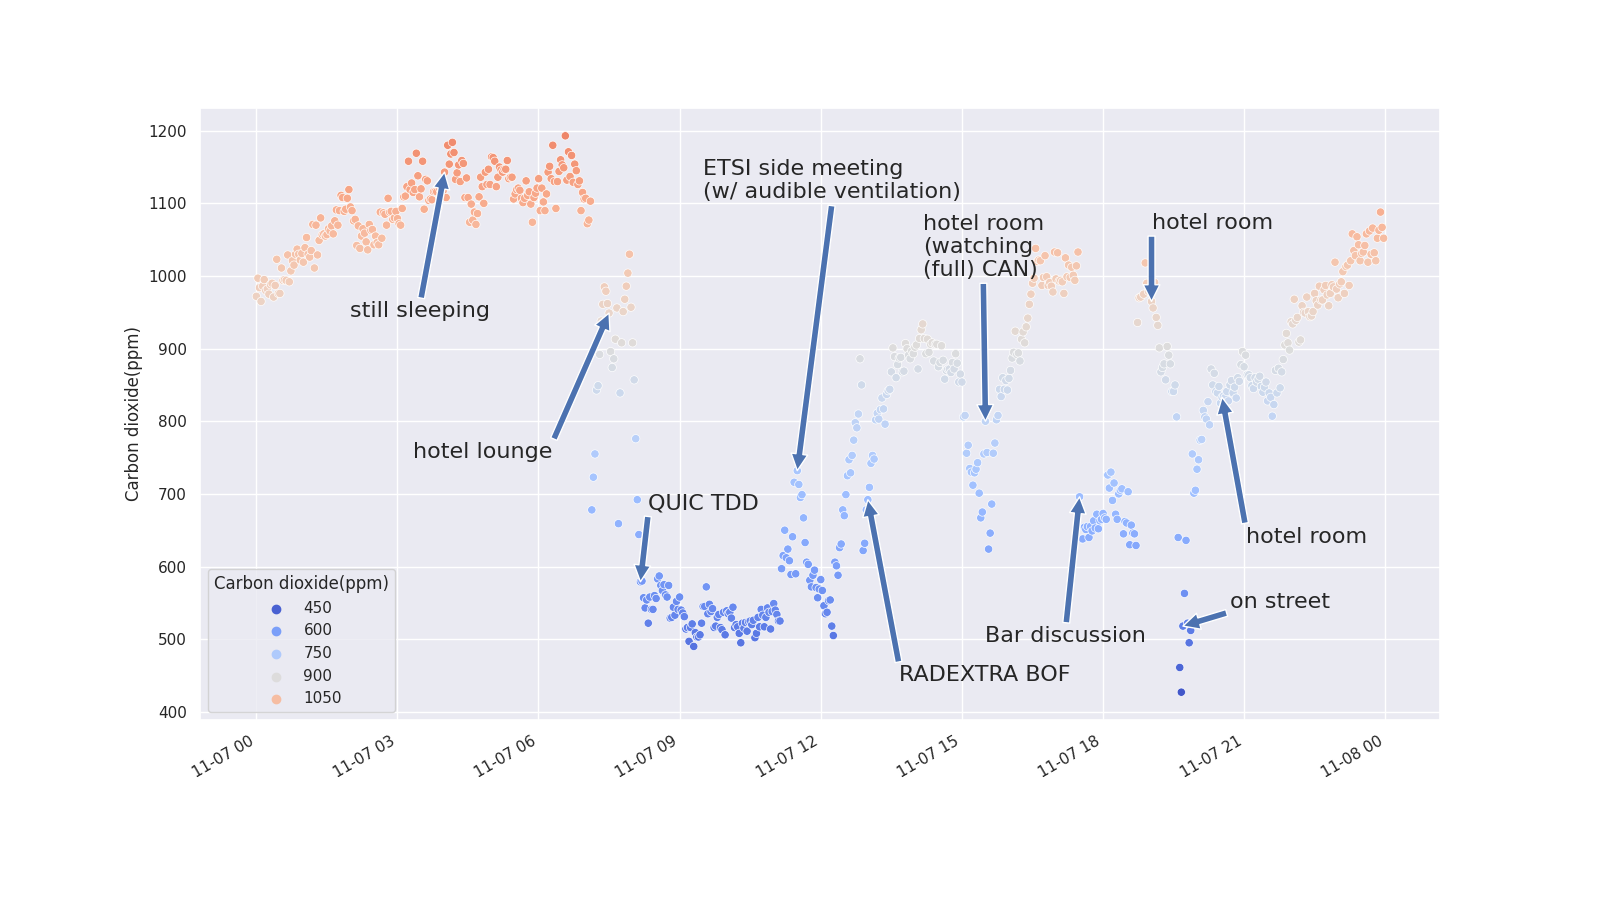
Take aways from the first real day:
- I was generally impressed by the meeting rooms for air circulation.
- The RADEXTRA BOF was an exception as it was held in a small, fairly full room, and thus the \(CO_2\) levels kept rising. This was in the "meazine 1-4" room, and the ramping started primarily after someone shut the doors to dampen the noise from the hallway. I wonder what it would have been like if the doors remained open.
- I got tired of seeing my hotel room continuing to be high (even though the virus risk is low), so I decided to do something about it…
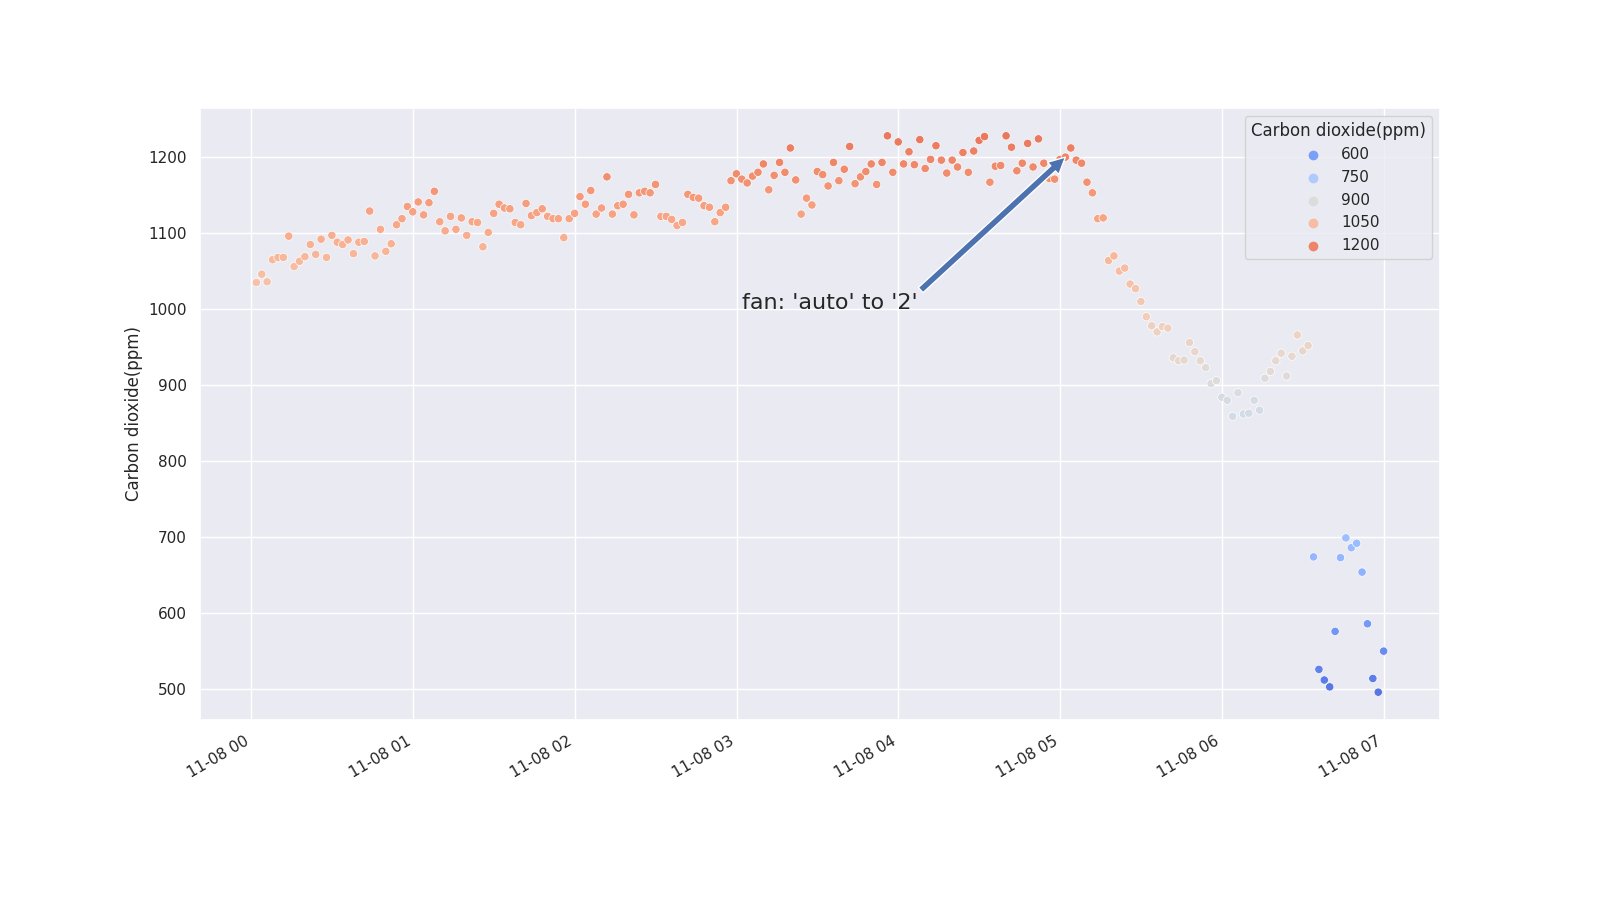
5.1. special news bulletin: turn on your room fan. always.
We interrupt this report for a special news bulletin…
One thing I've realized is that air circulation in my room is pretty poor because my fan was set to "auto" (naively thinking that "auto" means "do whatever you think is best for my health and comfort"). However, the \(CO_2\) levels creep up and up at this setting, though, (likely the room temperature didn't require much heating/cooling so the fan rarely turned on). Here's a graph of what happened in the morning after I turned the fan from "auto" to the medium (2) setting.
6. 2022-11-08 Tue: Day 2 – buses are a big problem
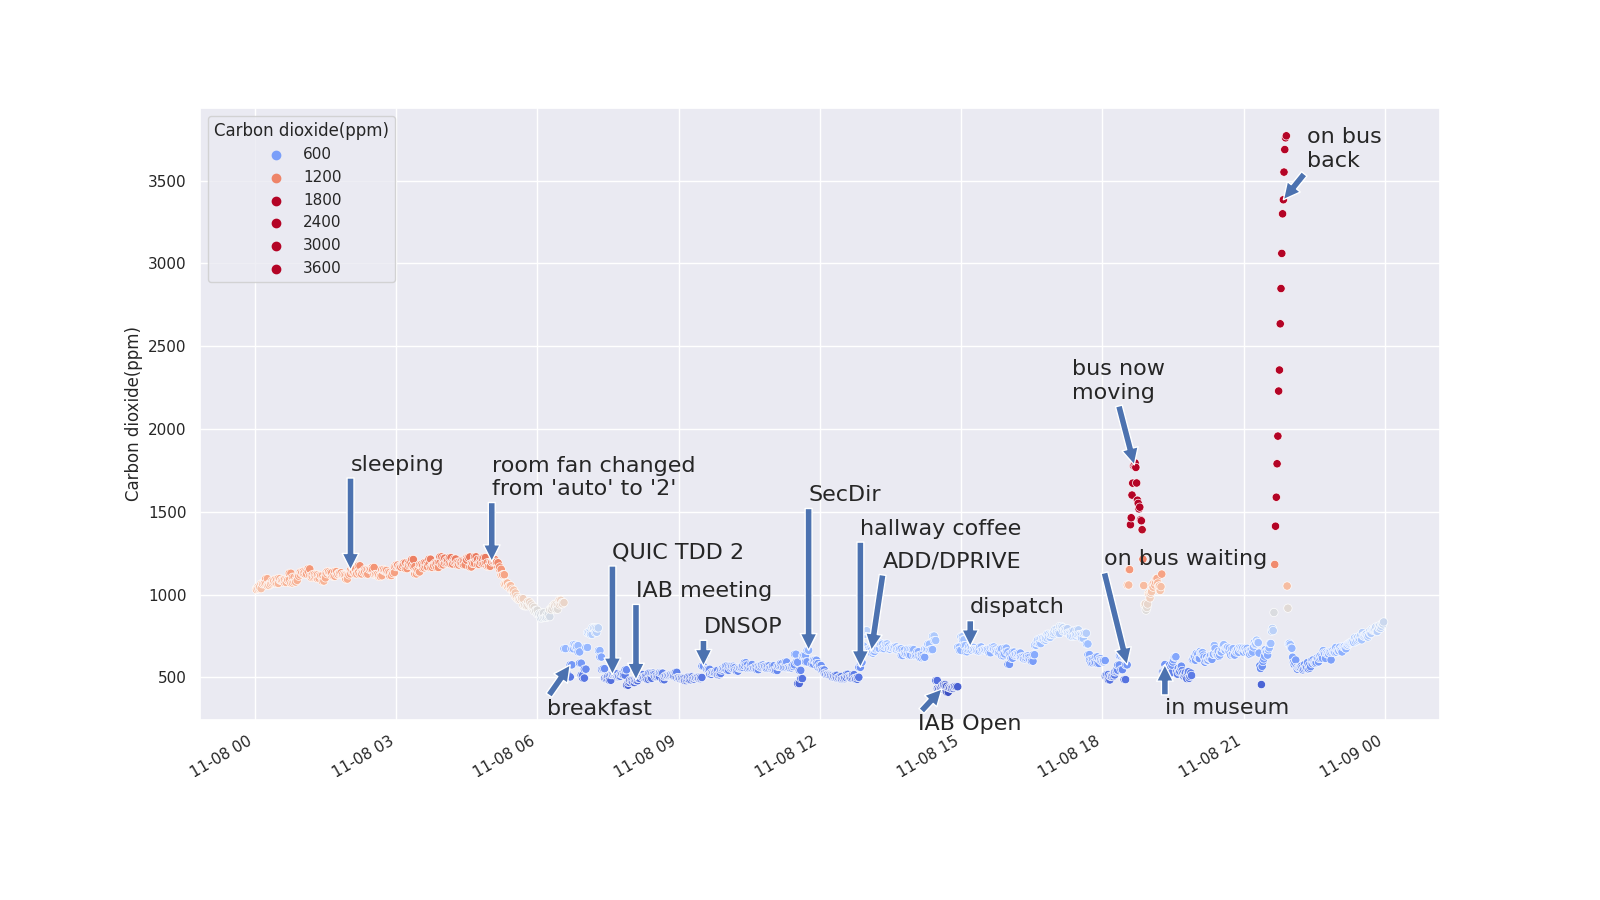
Notes from today:
- The meeting rooms I was in today relatively low \(CO_2\) levels all day.
- The social event required riding a bus there. Or walking. I should have walked. I was on the top of a double-decker bus next to a 1/4 opened roll-down window. I had my face generally pointed to the window the entire time trying to get the freshest air. My sensor, however, was sticking out of the top of my pants pocket. Hopefully the fresh air helped me avoid any contamination.
- The museum had a wonderfully fresh air blowing gently through its open front doors. That combined with the high, lofty ceilings meant that the \(CO_2\) rates were low until…
- My word that spike on the bus on the way home was depressing. (Note this was a more modern single-decker bus.) I can only hope that there was a good filter on the bus. But I bet not. I should have walked and risked getting wet in the London rain.
7. 2022-11-09 Wed: Day 3 – a generally cleaner air day

Notes from today:
- Today in general was fairly clean $CO2$-wise, except for the wgchairs lunch (and of course my hotel room, even with a fan on).
- I went to dinner and intended to take my meter to a restaurant, but failed to remember it in the rush to get there.
8. 2022-11-10 Thu: Day 4 – chairing two meetings
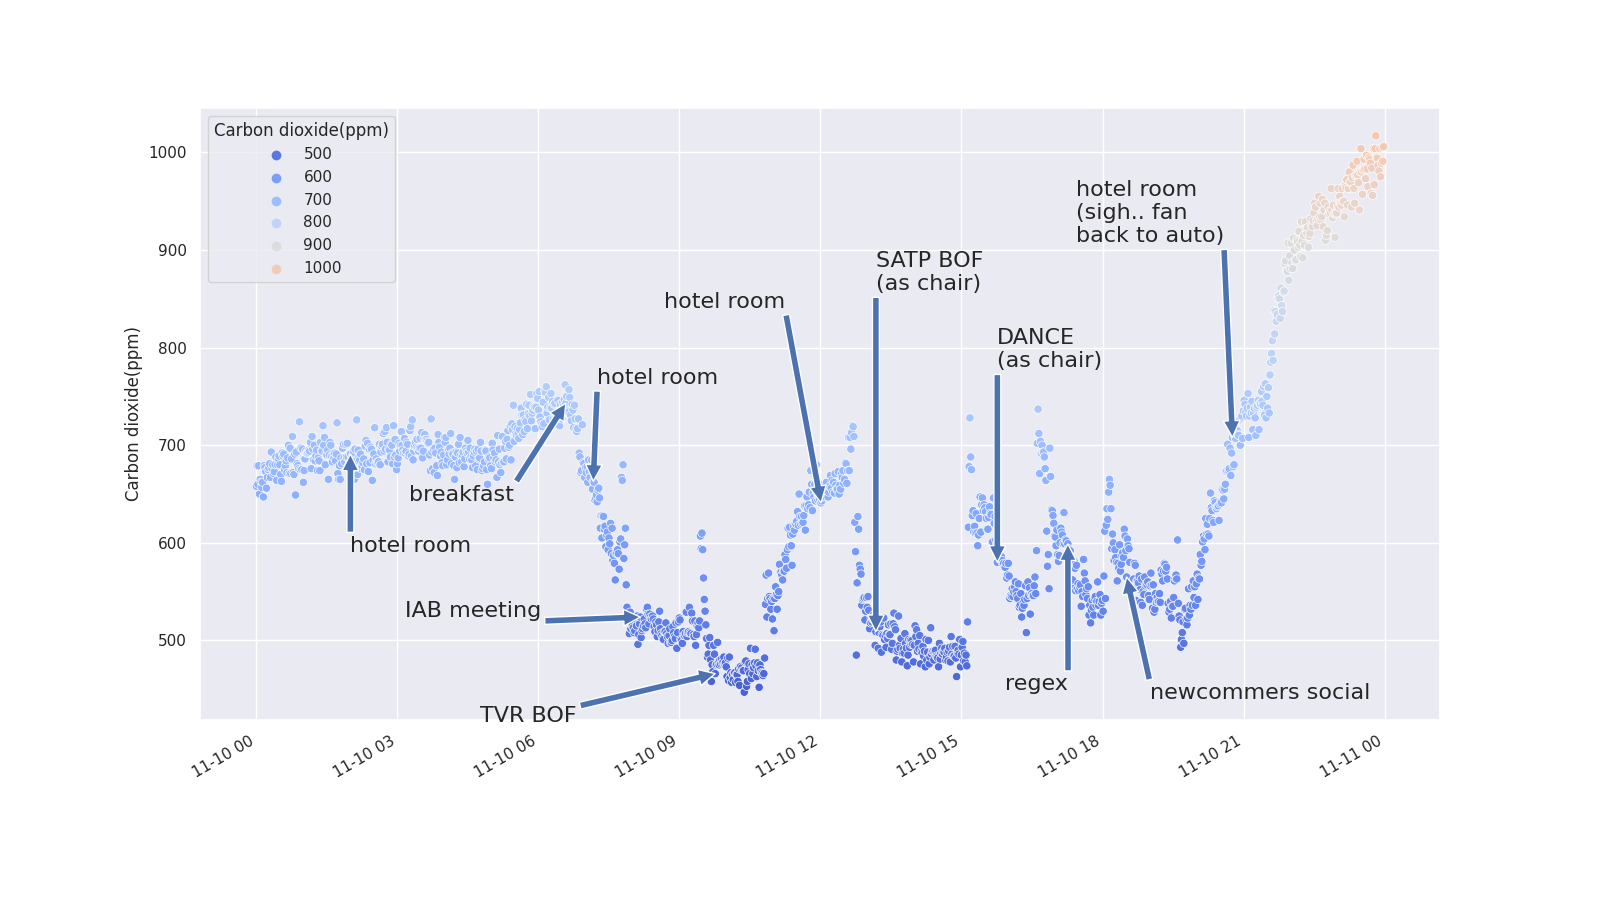
Notes from today:
- I chaired two meetings today, and not surprisingly the front of the room well away from most people had nice, clear air. The DANCE room was a smaller room too, so it's a touch higher but still generally low.
- The hotel room fan keeps thinking it's helping me by switching back to "auto". I wish it would stop trying to help me.
9. 2022-11-11 Fri: Day 5 – wrapping up the conference
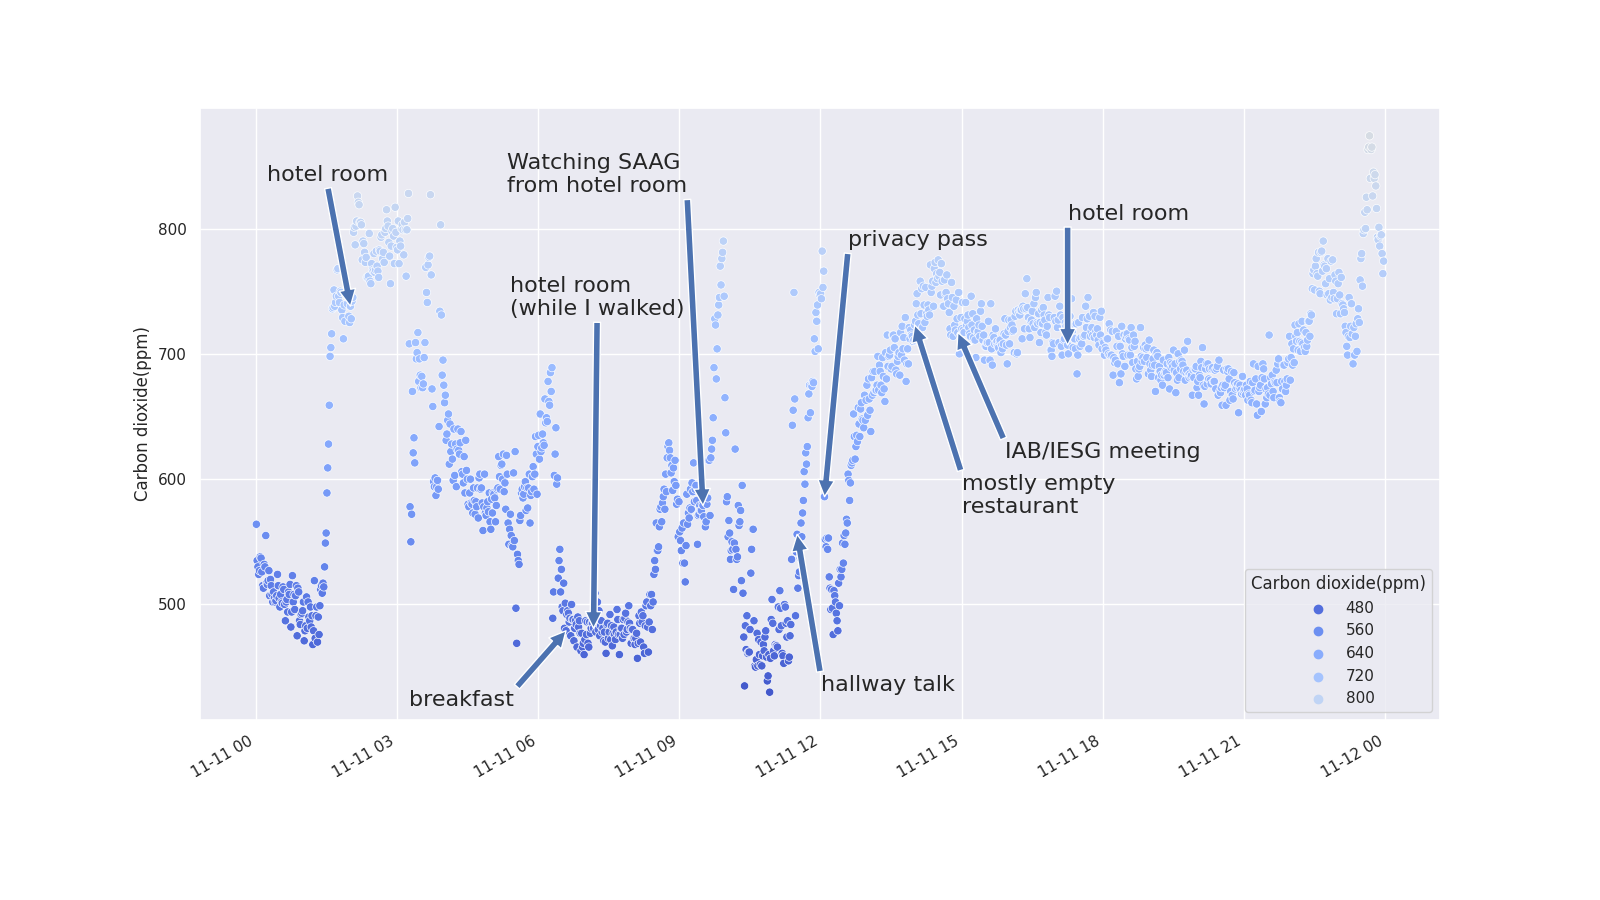
Notes from today:
- Generally a good air quality day over all
- I watched SAAG from my hotel room, as it was in a room I knew didn't have great circulation (see RADEXTRA BOF from Monday).
- Note the spike at the hallway talk – clearly this is a more dangerous activity than most meetings.
- I left the meter in the room while (mostly) out and about the rest of the day. I know the outdoors is just fine and didn't want to carry it.
10. 2022-11-12 Sat: The journey home
After a long conference, I often take a long walk before getting on a plane home. This time it was 12.8 kilometers (8 miles). Having worn out my feet on pavement, I headed for the airport for the two legs of my journey.
10.1. LHR to ORD
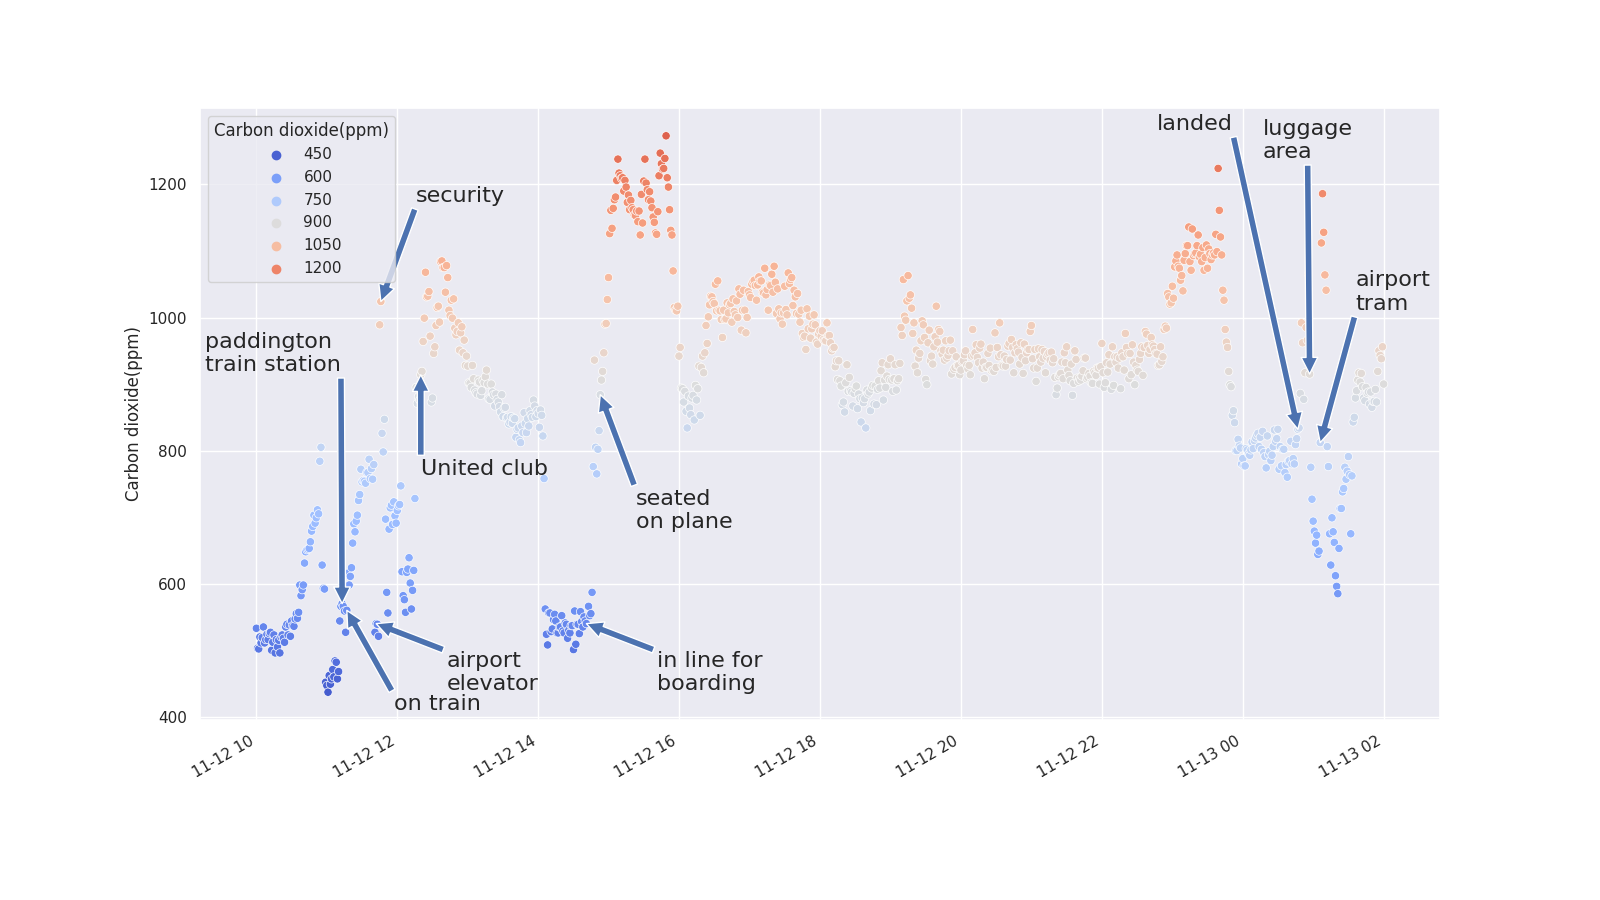
Notes:
- The united club again shows its lack of ability to circulate air well. You can see that I did manage to find a slightly lower \(CO_2\) spot after searching around a bit with my meter, but even settling near 800 or so wasn't ideal. Walking through the rest of the airport to get to and wait at the gate was much more reasonable.
- The flight profile looked fairly similar. Aim jets at my face and wearing a mask most of the time likely eliminated the risk on the plane.
- Landing in ORD was generally smooth, \(CO_2\) wise, but the luggage area was extremely crowded. Specifically, the line out of customs was long narrow with a low ceiling. That's the big spike to the right of the luggage area marker.
The airport tram was also not ideal (though it's hard to see in the graph). Fortunately I wasn't on it very long.
Note: the airplane was a Boeing 767-300.
10.2. ORD to SMF

Notes:
- The ORD airport tram spike is a bit more visible on this graph
- The united polaris lounge was less crowded and had a better profile (I was only there for about 15 minutes though)
- The gate, unfortunately, was crowded and though I showed up about the right time, boarding was unfortunately delayed by 15 minutes
- I failed to record the time at which I was seated and when we took off.
- The shuttle home, even though it had its air circulation at maximum had a horrible \(CO_2\) profile (I'm sure it didn't have HEPA filters). I wonder if he had it set to recirculate, which would have been pointless at best and just moving viruses around at worst. I couldn't see from where I was seated in the back though. Finally, only 3 people including the driver were in the shuttle. I wonder if some of the \(CO_2\) came from the engine (makes me wish I had a \(CO\) meter too)
Note: the airplane was a Boeing 737-800.