Please be aware the choice of formats for figures makes a big difference in technical papers in several ways: quality, render time, and file size.
There is a correct choice for each figure. Understanding the options can help.
TL;DR: Use PDF if you can, use PNG for line-art, use JPG for photos. Do not use JPEG for graphs or line-art–it will look bad.
What Are The Options?
There are three general options: PDF, PNG, and JPG. Briefly about each:
PDF is a standard format for documents and graphical images. It’s a great default. PDF is a vector format) where it describes what shapes to draw. As a result, it should be small in size, and yet will look good even if you enlarge the image.
PNG is a standard format for lossless images. It is great for icons, and for graphs, and line-art when you cannot use PDF. PNG is a bitmap format, so it represents the image as an array of colored squares, and if you zoom in, you can see the squares and the image will be blocky.
JPG (JPG is the usual extension, JPEG is the name of the format) is a standard format for lossy images. It is great for photographs, where will be much smaller than the other choices. JPG is a bitmap format (like PNG), so ultimately it’s image is an array of colored squares, but its lossy compression makes it smaller but also nosier.
(Details: yes, you can put bitmaps in PDF format images. Don’t do that, it only makes it harder to do things. There is also the GIF format, but for all practical purposes it is long since superseded by PNG.)
FOR DIAGRAMS AND GRAPHS IN TECHNICAL PAPERS: USE PDF (ALMOST ALWAYS)
Whenever you can (for example, if you’re using LaTeX) use PDF over bitmaps (JPG or PNG or GIF).
It will look better because a vector format can scale to any size and look good, while bitmaps look pixelated when zoomed too far.
And it will usually be smaller and render faster, because you say what to do (draw a line from here to there) not all the details (put a dot here put a dot here put a dot here…)
See https://en.wikipedia.org/wiki/Vector_graphics for more details.
PLEASE ALWAYS GENERATE PDF DIRECTLY FROM YOUR PLOTTING PROGRAM
You have to generate a PDF directly to get these benefits.
In gnuplot, do:
set terminal pdfcairo
If you generate a PNG and convert to PDF, you’ve already lost.
EXCEPTIONS: When NOT to use PDF
- In PowerPoint, support for vector graphics seems somewhat poor, so PNGs are necessary. Please generate PDF and then convert it to PNG.
I use this make recipe:
%.png: %.pdf
	pstoimg -antialias -aaliastext -depth 24 -density 200 -type png $<

figure.png: figure.pdf
-
If your source image is a photo, use JPG. There’s no point in converting it to PDF. (PDF will just encapsulate the JPG internally anyway.)
-
If your source image is actually a set of pixels (like a grid of radar squares), then a PDF doesn’t add anything and you can just use the PNG.
-
Screenshots are another case where your source image is a set of pixels. For screenshots, always use a PNG. (PDF will just encapsulate the PNG internally anyway.)
But you should also ask yourself: do I really want a screenshot, or do I want to show the text in the screenshot? Sometimes you want an screenshot (to say: this is real software, or if you have buttons and menus and such). But if your point is to show a CLI command, do you really need a screenshot or can you just put the text in a typewriter font?
Why not PNG? (For technical diagrams in papers)
A PNG bitmap will EITHER be low resolution and look pixelated, OR it will be high resolution (300dpi) and then be really really big (many megabytes).
High resolution bitmaps can easily make files many megabytes in size. Although that’s not the end of the world in 2023, it’s usually unnecessary.
Why not JPG? (For technical diagrams in papers)
JPG has the problems of PNG, PLUS for graphs it causes artifacts, as described below.
FOR PHOTOS IN PAPERS, ALWAYS USE JPG
JPEG is designed for photos. Please always use it for photos.
A professional photographer will probably take raw image formats, but that won’t work in a paper, and is not generally needed. (If you know what it is, you probably already know where you want to use it.)
Why not PDF? (For photos in papers)
There is no need to convert JPG to PDF, that doesn’t make it any better (the image is already a bitmap).
In fact, the best way to convert a JPG to PDF will just stick the JPG in a PDF container, gaining nothing and losing the ability to extract and edit the image.
Why not PNG? (For photos in papers)
Use PNG for cases described below, but not generally for photos. PNG will be bigger and gains nothing for photos.
Be careful re-saving JPG
In general, don’t edit JPGs. Each time you resave it, it can get recompressed. Since compression is lossy, each recompression can add more noise to the image.
FOR GRAPHS AND LINE-ART, ALWAYS USE PNG (if you can’t use PDF)
If you can’t use PDF, it’s critical to use PNG for graphs and line-art.
JPEG does lossy compression. Lossy compression is great for photos because changing a few pixels doesn’t matter, and the result is much smaller than a png. It’s designed explicitly for photos.
Lossy compression is awful for diagrams and line-art, because it causes little artifacts around the edge of straight lines and corners. (Convert a PowerPoint diagram with black-on-white text to JPG and then look at the text close up: you’ll see lots of extra black pixels).
Text and line graphs always have artifacts in JPG. Never use JPG for them. (You can hide them by making the resolution very high, or by setting the JPEG compression to 95%, but now you’ve got a huge image. And there are still little artifacts in there.)
Artifacts, are they really so bad?
Yes, when you zoom in, or when you look closely.
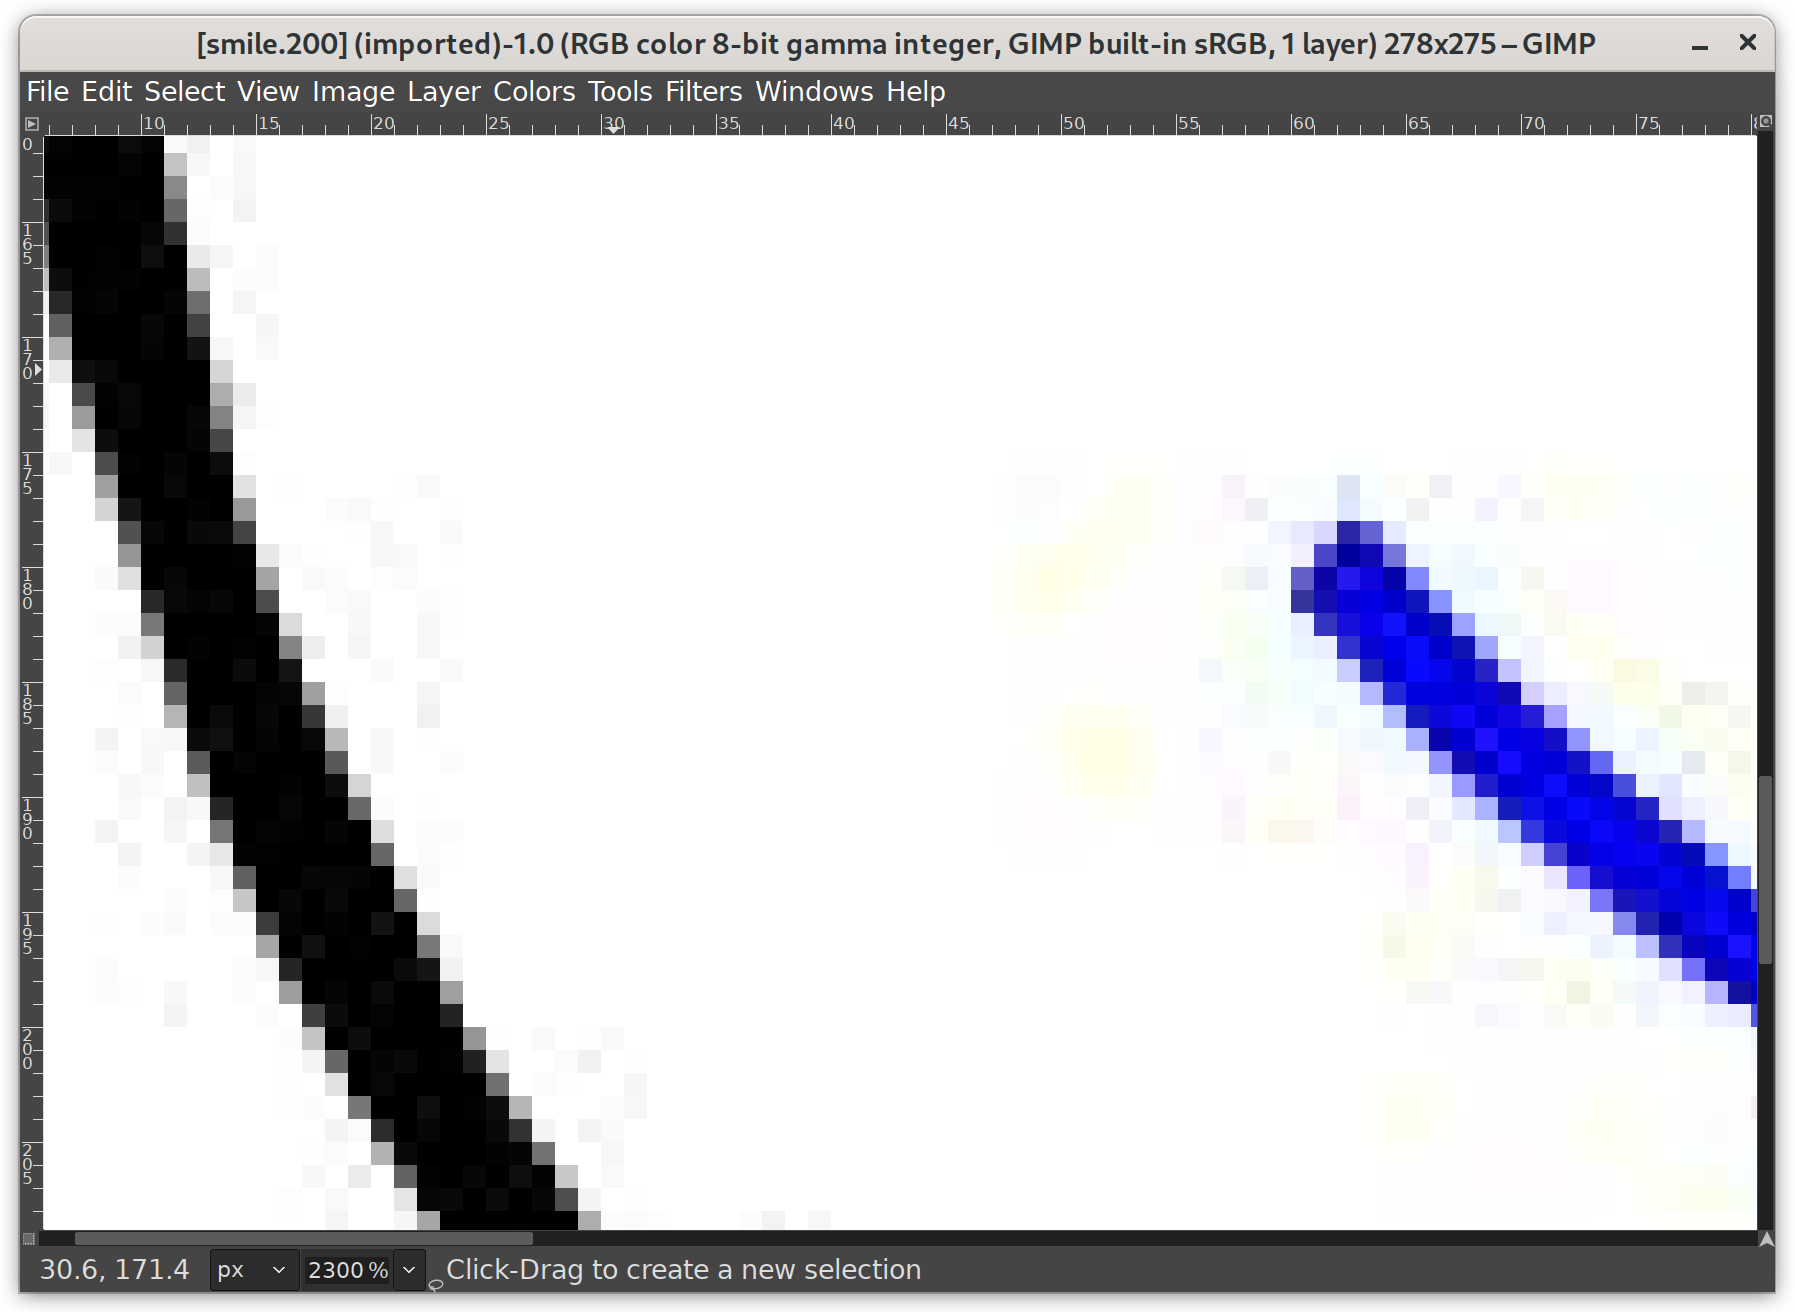
Compare these two smiley faces:


Look particularly around the curves–there are subtle boxes of dots. In fact, around the blue mouth, there are subtle yellow and red blotches.
See this zoomed in version:
Or this one where I exaggerated the colors to emphasize the artifacts:
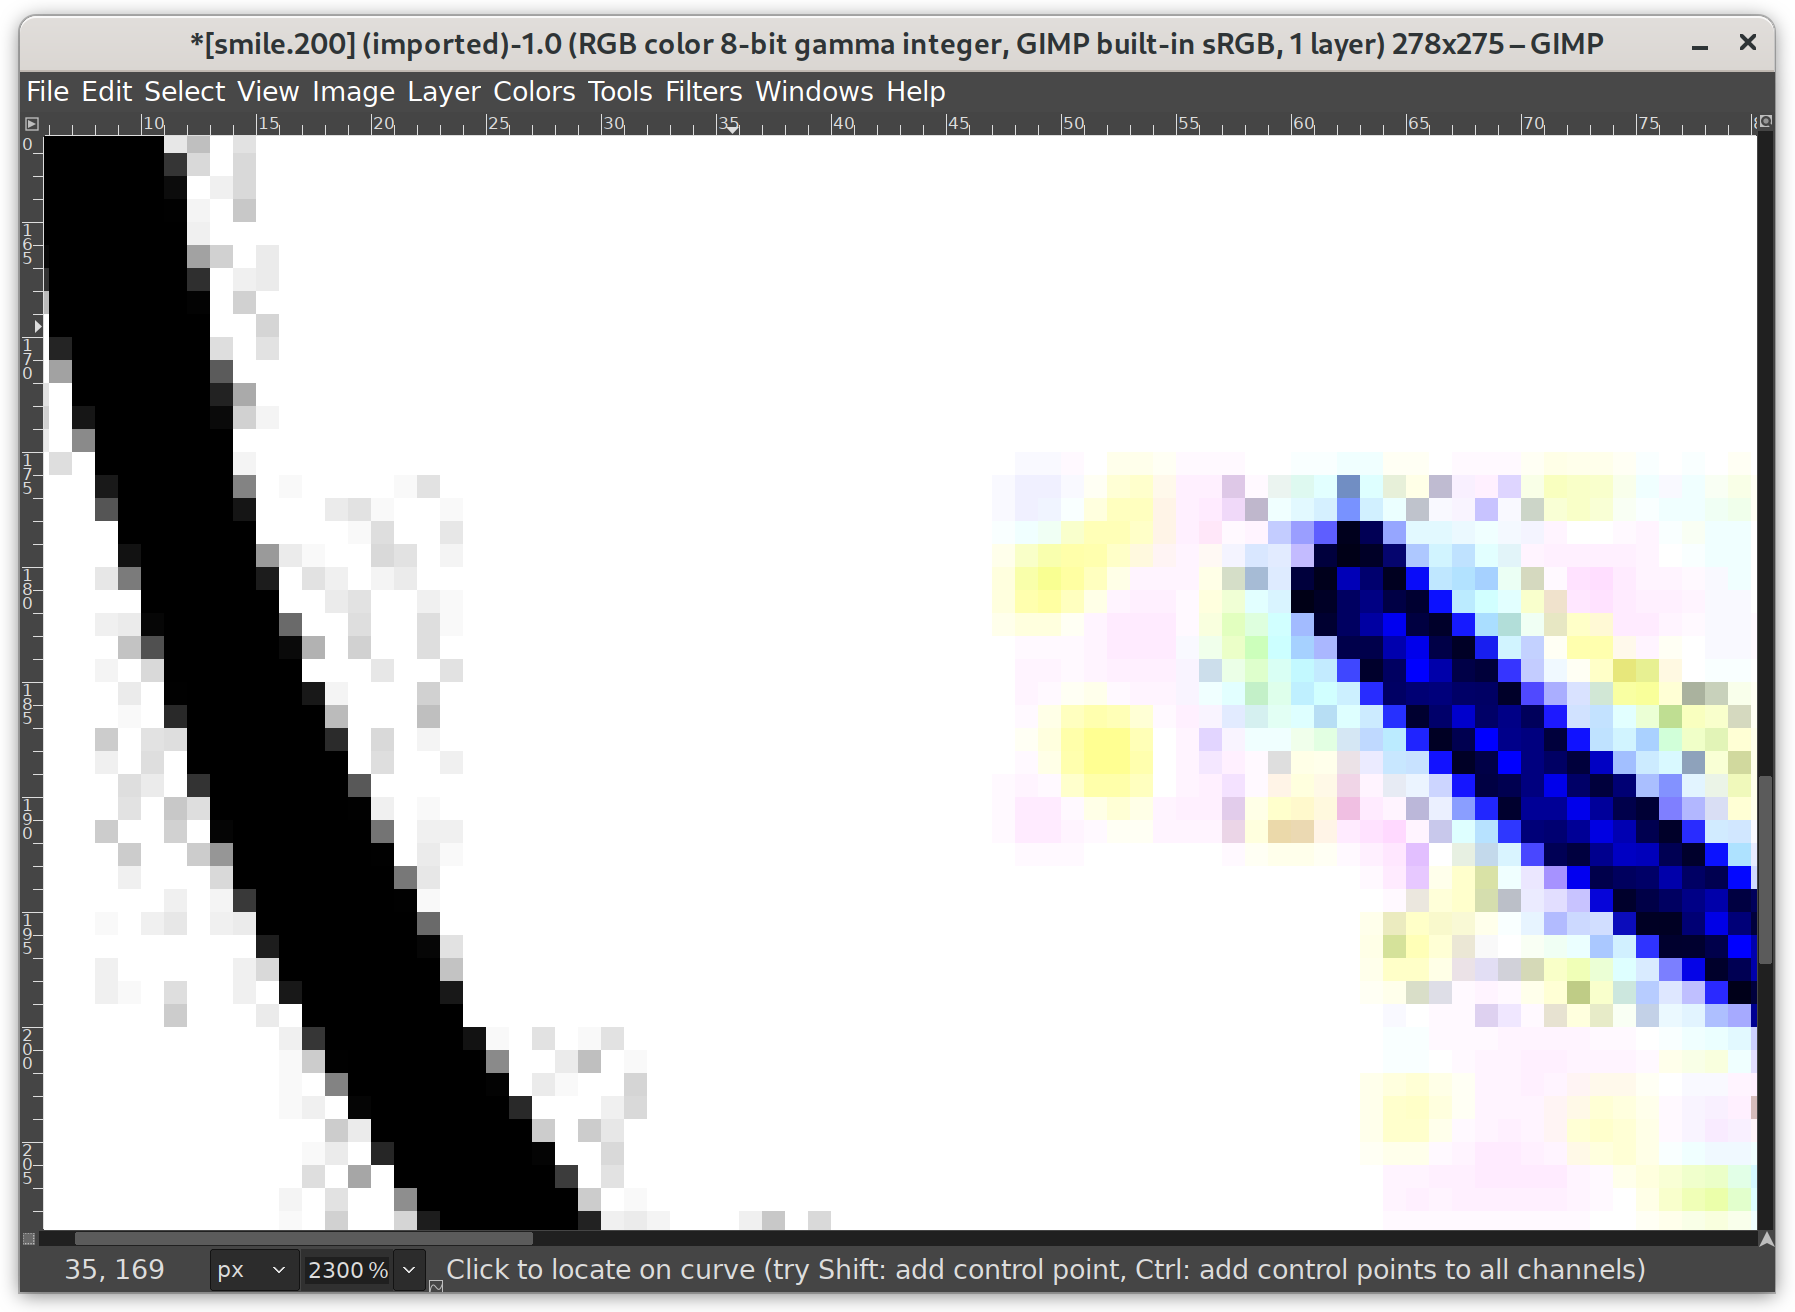
You don’t want little gray boxes around curves on your images! Curves are bad, text is bad. It’s all bad. Don’t make the smiley face’s unnecessary imperfections make your reader sad!
(If it was PDF, these artifacts wouldn’t occur. It it was a high-enough resolution PNG, the only artifacts would be due to anti-aliasing.)
Why not GIFs? (for graphs or line-art)
Please use PNG over GIF. GIFs have only 256 colors, but PNGs can have millions of colors.
(PNGs were started due to patents on the GIF format in the 1990s. The GIF patent has now expired, but PNG is still a better format for several technical reasons.)
(The only place GIF is still advantageous is for animation.)